Things I Forget: Push/Pull Greyed out in RStudio?!?

So, on more than one occasion I have set up a repository locally, then on GitHub and pushed to that repo from the shell. This works great, but this would always result in the Push and Pull buttons in RStudio getting greyed out. I could push just fine from the shell, but not from the GUI. Not a big problem, but always kind of annoyed me.

Today I took a bit of time to search for a solution and found my answer pretty quickly over on RStudio support.  All I had to do was simply push from the shell with the -u flag. This flag added an upstream reference.

Prior to fixing it my config looked like:

user.name=Jeff Hollister
user.email=jeff.w.hollister@gmail.com
core.repositoryformatversion=0
core.filemode=false
core.bare=false
core.logallrefupdates=true
core.symlinks=false
core.ignorecase=true
core.hidedotfiles=dotGitOnly
remote.origin.url=https://github.com/jhollist/hkm.git
remote.origin.fetch=+refs/heads/*:refs/remotes/origin/*

And after using git push -u origin master, my config had these two lines added at the bottom:

branch.master.remote=origin
branch.master.merge=refs/heads/master

I restarted RStudio and can now push and pull from the GUI.  Yeah!

Lastly, this really isn’t something I have forgotten yet, I just looked it up. But, it does seem like something I would forget. I am just being proactive here.

A great idea: R Markdown for Undergrads

A recently published paper by Baumer et al (2014) caught my eye today (HT to Bruce Caron).  I wanted to share it here because I thought it was cool and also had a few comments to make about some of the issues the authors raised.

First, a bit about the paper.  Partly in response to all the media attention to the crisis in reproducibility in science (e.g. Nature) Baumer and colleagues made some changes to introductory statistics classes at Duke, Smith, and Amherst.  The primary change was to require the use of R Markdown for all homework.  RStudio was the editor they used and it appears any cutting and pasting of code, figures, etc. was not allowed.  They conducted a survey of the students early in the class and after the class.  The end result was that students preferred using R Markdown over the typical mode of cut and paste.  They may have grumbled a bit about learning R Markdown but the benefits were obvious to them.

Getting these students using R Markdown and creating reproducible homework assignments is a fantastic thing, in my opinion.  I have worked with younger researchers (although not undegrads) and with older ones.  Convincing younger researchers of the benefits of R Markdown and the general concept of reproducibility is pretty easy.  To put it bluntly, the older researchers are a pain…  There are ALWAYS long conversations (er, arguments) about why their method is not any different than a reproducible one, why their method it is better, etc.  I suppose the “old dog, new tricks” is apropos.  The moral of the story is that teaching undergrads reproducibility and Open Science in general will have many long term benefits and what Baumer and colleagues have done should be more widely adopted.

Aside from my being a big fan of what they did, I have one response to an issue they raised in the paper.  On pages 16-17 the authors discuss the need to collaborate on R Markdown documents and suggest Dropbox as a possible solution. While that might work, I think a better option is to use Git and Github.  This is, I think a great opportunity to introduce version control early on to the students and it fits right inline with the open science and reproducibility theme of the authors efforts.

So in short, what Baumer and colleagues are doing is great. It would be FANTASTIC if they added Git/Github to the mix.

Rstudio and makefiles: Mind your options!

I have written this post mostly for myself. I don’t want to waste 2 hours on this problem again at some point in the future.  Hopefully others might stumble on it too and save some aggravation.

So, the issue I had this morning was writing up a a makefile in RStudio.  I am new to make and makefiles, but have been able to get them running successfully in the past; however, the makefiles I’ve used were mostly borrowed from others and only minor edits were made.  This morning I was trying to add a new target and some dependencies.  As most of my work these days is with R, I prefer to do most of my writing and editing directly in RStudio.  Thus, I fire up RStudio, penned some great prose in R Markdown, and then went to add a new target to a makefile that was to take my R Markdown file, and create an output .pdf and .docx.  Seemed simple enough.

Here’s the makefile like the one I created:

all: file.md file.pdf file.docx

file.md: file.Rmd
  Rscript -e "library(knitr); knit('file.Rmd')"

file.pdf: file.md
  pandoc -H format.sty -V fontsize=12pt file.md -o file.pdf

file.docx: file.md
  pandoc -s -S --reference-docx=format.docx file.md -o file.docx

Looks pretty good!  Or so I thought.  I sauntered on over to my terminal window, and confidently type make and, it runs the first target fine, and then stops… Next step for me was Google and I was rewarded with A Brief Intro to Makefiles. Ah ha! My problem is the tabs. I then head back to RStudio, dutifully replace what I thought were spaces with tabs, run make. Same problem.

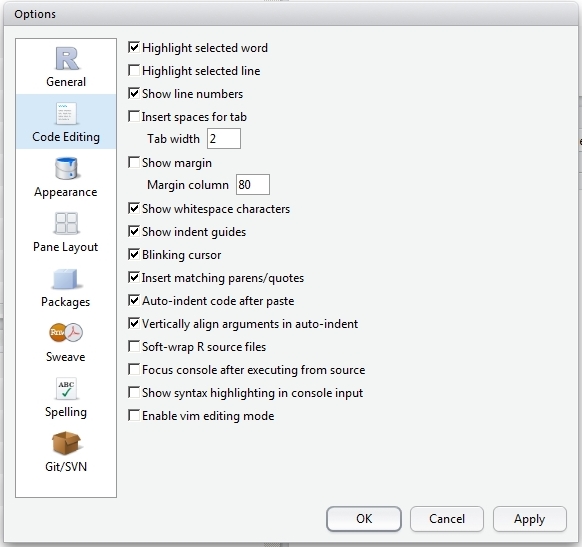
This next step took me a while of trying the same thing over and over again, but expecting something different. Say what you will about me. After this brief foray into insanity I then realized that I had my options in RStudio set to replace tabs with spaces. Again, I think I have the problem licked. In RStudio, I go to Tools:Global Options:Code Editing and click off my “Insert spaces for tab” option. That looks like:
GlobalOptions

After making this change, I once again replace my spaces with tabs, try again, and still no good.  At this point I am sure I know the problem is related to the spaces, but for the life of me I can’t figure out why RStudio tabs are still getting input as spaces.  I give up and copy/paste everything into notepad++, reset my tab options there and go about replacing the tabs.  This time it works.

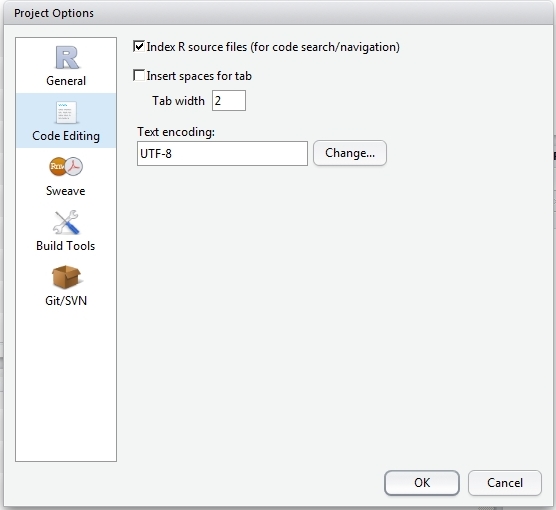
While I got my makefile working, it was a very unsatisfying solution.  I kept digging and am pleased to report RStudio is not to blame (I never thought it was. User error all along).  As is turns out there is an additional Rstudio Project level option that also controls the tabs.  I have now checked off Tools:Project Options: Code Editing: Insert spaces for tab. That looks like:
ProjectOptions

At long last my tabs are tabs and my makefile makes and it can all be done in RStudio, provided I take care of my options.

SPARROW + Lake Volume + Field Data = PLOS ONE Paper

So this one goes in the category of shameless self-promotion (or shameless promoting of my co-authors).  We have a new paper out in PLOS ONE about how we combined the USGS SPARROW model, modeled lake depth and volume, and field data from the National Lakes Assessment to improve predicitons of TN and TP.

There is no need for me to re-hash this here, you can check out my blog post on EPA’s It All Starts With Science Blog.

Ref:

Milstead WB, Hollister JW, Moore RB, Walker HA (2013) Estimating Summer Nutrient Concentrations in Northeastern Lakes from SPARROW Load Predictions and Modeled Lake Depth and Volume. PLoS ONE 8(11): e81457. doi:10.1371/journal.pone.0081457

RStudio, and Presentations, and Git! Oh my!

I have been using R for many years now and it has served me quite well.  I have used it for all manners of data prep work, analysis, developing figures, and more recently GIS and creating reproducible reports with knitr.  During this time my typical workflow included creating new folders for projects, throwing in an R shortcut that opens in the project folder directory and developing my scripts and functions with Notepad ++ (used to be TINN-R). As I was using mostly R, some LaTeX, and some Python, Notepad ++ seemed to be a good fit. I had seen a few other folks in the office using RStudio, but wasn’t interested in making the switch.

So, fast forward several months. I am now more active on Twitter (@jhollist, if you are interested) and have started this blog. As a result, I am much more aware of the general goings on in the R world (HT @Rstudioapp, @ropensci, @hadleywickham, @rbloggers just to name a few). This has made me aware of the many cool things getting developed by the R Studio crew. Two that really caught my eye were Shiny and R Presentations.

Also during this time, I have been reading up on using Markdown and version control for collaborative writing (i.e. see Inundata and associated publications). The combination of these pointed towards giving RStudio and Git a try. What follows is a very abbreviated account of my experience and a few hints to get up and running.

What do you need to get up an running?

  1. Install Git:  For my setup I simply grabbed the git installer.
  2. Get a Github account: If you don’t have one already, head over to Github and set up an account.
  3. Install the preview version of RStudio (at least its a preview as of the date of this post):  The currently available RStudio Preview version is 0.98.456.  Why is this interesting?  Well,  you can create R Presentations with it.
  4. Start a version controlled project and connect it to your Github account: First, create a new repository on Github.  When that is created copy the https URL for the repository.  Second, create a new project in RStudio, selecting the “Create Project From: Version Control”.  Choose “Git” as the version control and in the “Repository URL” field put the https URL of your newly created Github repository.  You should be able to commit locally and push to your master branch on Github.
  5. Create a presentation: Now all you need to do is read up on some of the basics of R Markdown for presentations and have at it.  Once written, click on the “knit html” button and save as html.  Use that or push to web!

Hints:

Most of the dithering was not at all with getting the presentations built and RStudio up and running, it was with the layout.  As I am an extreme novice with CSS it took me some time to get everything where I wanted.  But I did eventually get it set.

First thing I had to figure out was how to get changes to the CSS implemented.  From my reading I found three ways:

  1. Edit the default style sheet:  On my system, it is located at C:\Program Files\RStudio\resources\presentation\slides.css. Simply add the changes you want to the end of the file, save, and restart RStudio. Now every new presentation you start will have your slide template implemented. Couple of warnings for this. First, if you install a new version of RStudio, your customized default CSS will get overwritten. Second, and this is just good practice, save a copy of the original (or better yet, use Git to track the changes) so if you really mess up you don’t need to do a reinstall.
  2. Use a custom style sheet:  Copy the default and edit it to your liking.  Once you have that finished simply throw in the following line at the top of your presentation directly under your title slide: css: mySlideTemplate.css
  3. Add styles directly into the presentation:  As knitr converts the R Markdown into html you can simply add the styles at the top of the presentation and they will get included when you knit to html.  See the RStudio write up for more info.

Some of the changes I wanted to make were to set the backgrounds for all slides to white, add in a topbar on each slide and re-position the slide titles.

To change the title slide background color and text color:

.section .reveal .state-background {
    background: white;}
.section .reveal h1,
.section .reveal p {
    color: black;
    position: relative;
    top: 4%;}

To add a top bar:

.reveal .present {
   background: white;
   background-image: url(http://jhollist.github.io/files/images/TopBar.jpg);
   background-repeat: no-repeat;
   background-position: 0% 9.35%;
   background-size: 100%;}

And to move the slide title but not the subsequent h3 tags:

.reveal h3{
   position: relative;
   top: 0%;
   left: 0%;}
.reveal .slideContent h3{
   left: 0%;}

What I would like to see added:

Two things that I tried to get working but couldn’t were more control over the positioning on some of the text (e.g. centering) and the ability to output presentations as PDF. The positioning issue is likely do to my lack of experience with Markdown. The PDF issue sounds like a common challenge with the Reveal.js based presentations. Since the R Presentations are still part of the preview, this is just me being picky.  I realize many of these kinds of issues will get worked out with future releases.

Verdict

So, my verdict after a month or so with RStudio… I’m hooked.  I am now using it for presentations (just completed my third one) and to top it off, I am pushing those presentations up to my Github page (still in development) and presenting via the web.  I have created a template for the presentations that will work for what I need at work and now it is simply a matter of plugging in the text and images for my presentations.

Presentations aside, I have only had a chance for some limited analysis with RStudio (thanks government shutdown), but the editor in general is, at a minimum, on par with everything else I have tried but likely will prove to be an improvement over what I have gotten used to.

In short RStudio has a very shallow learning curve, the integrated environment makes work easy, the interface is nice, and the options (Git, Presentations, Shiny Apps, Sweave, etc.) are fantastic.  If you are thinking of making the switch, do it.

Lastly, apologies for the cheeky title.  My internal Kansan got the better of me.

Post-Doc Position: Landscape Scale Cyanobacteria Modelling

So, I normally try to keep work stuff and blog stuff separated, but I figured the four of you who read this might be or know of someone who might be interested in a one year (with possible extension) contract position with my research group at US EPA in Narragansett, RI. And besides, its my blog. I can do what I want.

Our group works on various aspects of Cyanobacteria including toxicology, epidemiology, economics, and ecology. The focus of the post-doc is to help build National scale models of the probability of cyanobacteria bloom events in lakes across the US. Candidates with backgrounds in limnology, aquatic ecology, landscape ecology, and statistics would all be very competitive. Experience with R, Python, Bayesian methods and/or machine learning a definite plus. More information is here.

Please be aware this position is a contract position so the announcement reads a bit different. Don’t let that dissuade you. We are a fun group!

An R function to download shapefiles

This post is a follow up from my latest Things I Forget post on reading in shapefiles.  That post assumed that you already had access to all the relevant files (e.g. .shp, .shx, .prj, .dbf, etc.).  A task that I routinely need to do is locate shapefiles on a website, grab those files, and read them in.  Instead of having to do this manually I wrote a function a while back to take care of this task.  The function simply requires shape_url, a link to the location of the files, and layer, the name of the shapefile. Currently the layer should not contain the .shp extension. There is also an optional parameter outfile that can be used to create a different name for the downloaded files.

I haven’t spent much time on error handling. For instance this function assumes you already have rgdal and sp installed and loaded. If you try to use this and get an error, let me know in the comments and I’ll try to fix it. Or better yet suggest a change and I’ll throw it in!

So here is the function.

download.shapefile<-function(shape_url,layer,outfile=layer)
{
  #written by: jw hollister
  #Oct 10, 2012

  #set-up/clean-up variables
  if(length(grep("/$",shape_url))==0)
  {
    shape_url<-paste(shape_url,"/",sep="")
  }
  #creates vector of all possible shapefile extensions
  shapefile_ext<-c(".shp",".shx",".dbf",".prj",".sbn",".sbx",
                   ".shp.xml",".fbn",".fbx",".ain",".aih",".ixs",
                   ".mxs",".atx",".cpg")

  #Check which shapefile files exist
  if(require(RCurl))
  {
    xurl<-getURL(shape_url)
    xlogic<-NULL
    for(i in paste(layer,shapefile_ext,sep=""))
    {
      xlogic<-c(xlogic,grepl(i,xurl))
    }

    #Set-up list of shapefiles to download
    shapefiles<-paste(shape_url,layer,shapefile_ext,sep="")[xlogic]
    #Set-up output file names
    outfiles<-paste(outfile,shapefile_ext,sep="")[xlogic]   }
    #Download all shapefiles
    if(sum(xlogic)>0)
    {
      for(i in 1:length(shapefiles))
      {
        download.file(shapefiles[i],outfiles[i],
                      method="auto",mode="wb")
      }
      } else
      {
      stop("An Error has occured with the input URL
            or name of shapefile")
    }
}

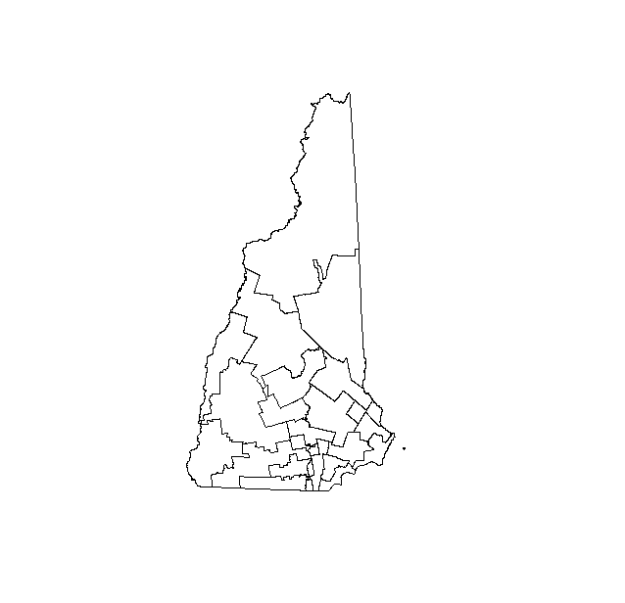
And now to prove it works I can do something like the following:

#Download the NH State Boundaries
download.shapefile("ftp://ftp.granit.sr.unh.edu/pub/GRANIT_Data/Vector_Data/Administrative_and_Political_Boundaries/d-nhsenatedists/2012",
                   "NHSenateDists2012")
#Read shapefiles in SpatialPolygonsDataFrame
NHBnd<-readOGR(".","NHSenateDists2012")
#Plot it
plot(NHBnd)
New Hampshire State Boundary and Senate District

New Hampshire State Boundary and Senate District

Lastly, there are some other approaches for tackling related problems listed below.

claimtoken-5249c78db4c7a

Things I Forget: Reading a Shapefile in R with readOGR

One of the more common ways that I read vector data into R is via shapefiles.  I tend to use these partly becuase of my own sordid past with Arc/INFO, ArcView and ArcGIS and partly due to their ubiquity.  In any event I have found the R package, rgdal, indespensible for this.  One of the workhorse functions for pulling in vector data is readOGR().  It has two required parameters dsn and layer. The part I never remember is how these relate to shapefiles. There is nothing especially tricky about it, I just tend to forget what the dsn is and what the layer is. In short the dsn is the directory (without a trailing backslash) and the layer is the shapefile name without the .shp.

So, here’s the actual code so I don’t have to look it up again.

If the shapefile you are reading is in your current working directory the dsn refers simply to that directory. So all you need is simply a “.”. The layer is the name of shapefile without an extension. So it would look something like:

myShapeInR<-readOGR(".","myShapeFile")

Now, if that file resides elsewhere, the trick is to remember what the heck dsn refers to. Again it is simply the directory where the shapefile resides. So if I had a shapefile in a place like C:/data I would use the command like:

myShapeInR<-readOGR("C:/data","myShapeFile")

There, it is really quite simple, yet I always mess it up. Not any more.

I hope.

Open Access and Landscape Ecology

I’ve got a dilemma.  I recently received a request to review a manuscript for the journal, Landscape Ecology.  It is the primary journal for the field.  If I am to be a good landscape ecology citizen I really should do the review.  The problem is that Landscape Ecology is not an Open Access journal.  If I am to be a good science citizen then, I believe, I should do all I can to support Open Access.  So, I am left with the decision to support the field and society I have been active in for years or support Open Access, which I support fully yet am only a recent convert. As I see it I have four options:

  • Review and be quiet
  • Don’t review and be quiet
  • Don’t review, but provide an explanation to the editor.    This is much like what Scott Chamberlain, Casey Bergman, Michael Ashburner and others have done.
  • Review, but provide an explanation to the editor and try to start a discussion about migrating Landscape Ecology to Open Access.

I have decided on the last option.  First, I respect the decision others have made to say no to the review.  In some case, I think that would be the best path.  However, I have been active with US-IALE for several years and would feel more hypocritical just saying no.   Thus, for me, the decision I feel best with is to try and support the journal while also pushing for change.  In short,  I am hoping that I will be able to serve both sides.

By doing this,  I can feel as if I am doing my landscape ecological duty and provide a good and constructive review (assuming of course that I am capable of a review that is both good and constructive).  But at the same time I can register my discomfort with the current publishing model to which my field’s flagship journal adheres.  My plan is to agree to the review, but also include some language in my acceptance about my hesitation due to the closed nature of our journal.   Additionally, I will share my thoughts with the papers authors and suggest that, if feasible, they explore publishing the article under the open access license.   Lastly, I plan to start a discussion within our national chapter of the society.  At a minimum I can at least raise the issue.  If I am a bit more successful , then I can hopefully encourage others to act similarly.  At best, I can start a conversation with our journals editorial board to plan how and when Landscape Ecology could go completely Open Access. I do wonder what others think about this plan to encourage change and also what the consensus is on Landscape Ecology switching to an open access model.

Things I Forget: Installing new python packages on Windows

I can never remember how to do simple things, be it in Python, R, or Java (hope I don’t have to do too much more work in Java…).   Given that, I plan to post these kind of things, when I remember of course, under the title of “Things I Forget”.  My primary aim for this is to help myself, but I do hope others with a similar memory affliction will also find these useful.

For this first installment: How do you add new python packages from a tarball (i.e. .tgz or .tar.gz file) on Windows?

The Steps:

  1. Hope there is a windows installer.  Given how unlikely this appears to be, move to step 2
  2. Download the tarball.  This is the thing you always see when you are expecting to find the windows installer.  It has some name followed by a .tar.gz or a .tgz.  For instance, if you want to add the ability to write out Excel files (by the way,  I am not advocating for Excel), then you could use the xlwt package.   I usually download these files directly into my into my site-packages directory (C:/Your Python Path/Lib/site-packages).
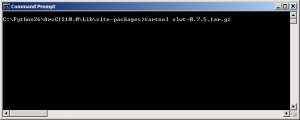
  3. Once you download the taball you need to find someway to extract the file.  On linux machines this is easy.  I had a bit more of challenge getting it to work on a windows machine.  There are a few options.  I have used PowerArchiver before, but it costs.  Cygwin can do it, but that may be overkill.  The one I have used most recently is the very simple TarTool.  It is free and doesn’t need to be installed, only extracted.  I also keep the TarTool.exe in my site-packages directory.  So, now that I have my tool to extract the file and the file itself, I simply do the following (click for full size):
    tartoolDOS
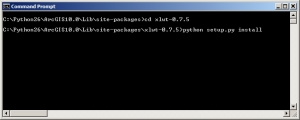
  4. Now you will have a directory for the package, so to install it is simply a matter of changing into that directory and running the setup.  Just like this (click for full size):
    setupPythonPackage
  5. Your python package is now ready to roll and can be imported (click for full size)!
    testPythonPackage

As an aside, anyone know of a wordpress trick to display a DOS command prompt?  Inserting a screen shot was the best I came up with, but it would be nice to have something akin to the method for highlighting sourcecode.